What the Builder Does
Open Reports → Report Builder. Besides building your own layout, you can start from a ready-made view: KPI Report, Top Campaigns or Coupon Report. Each one sets the columns and sort order and leaves your filters as they are. Report Builder is included on plans with Custom Reports.
You choose what to group by, what to measure, and what to include. The builder assembles the query and returns a table with summary cards and a chart above it.
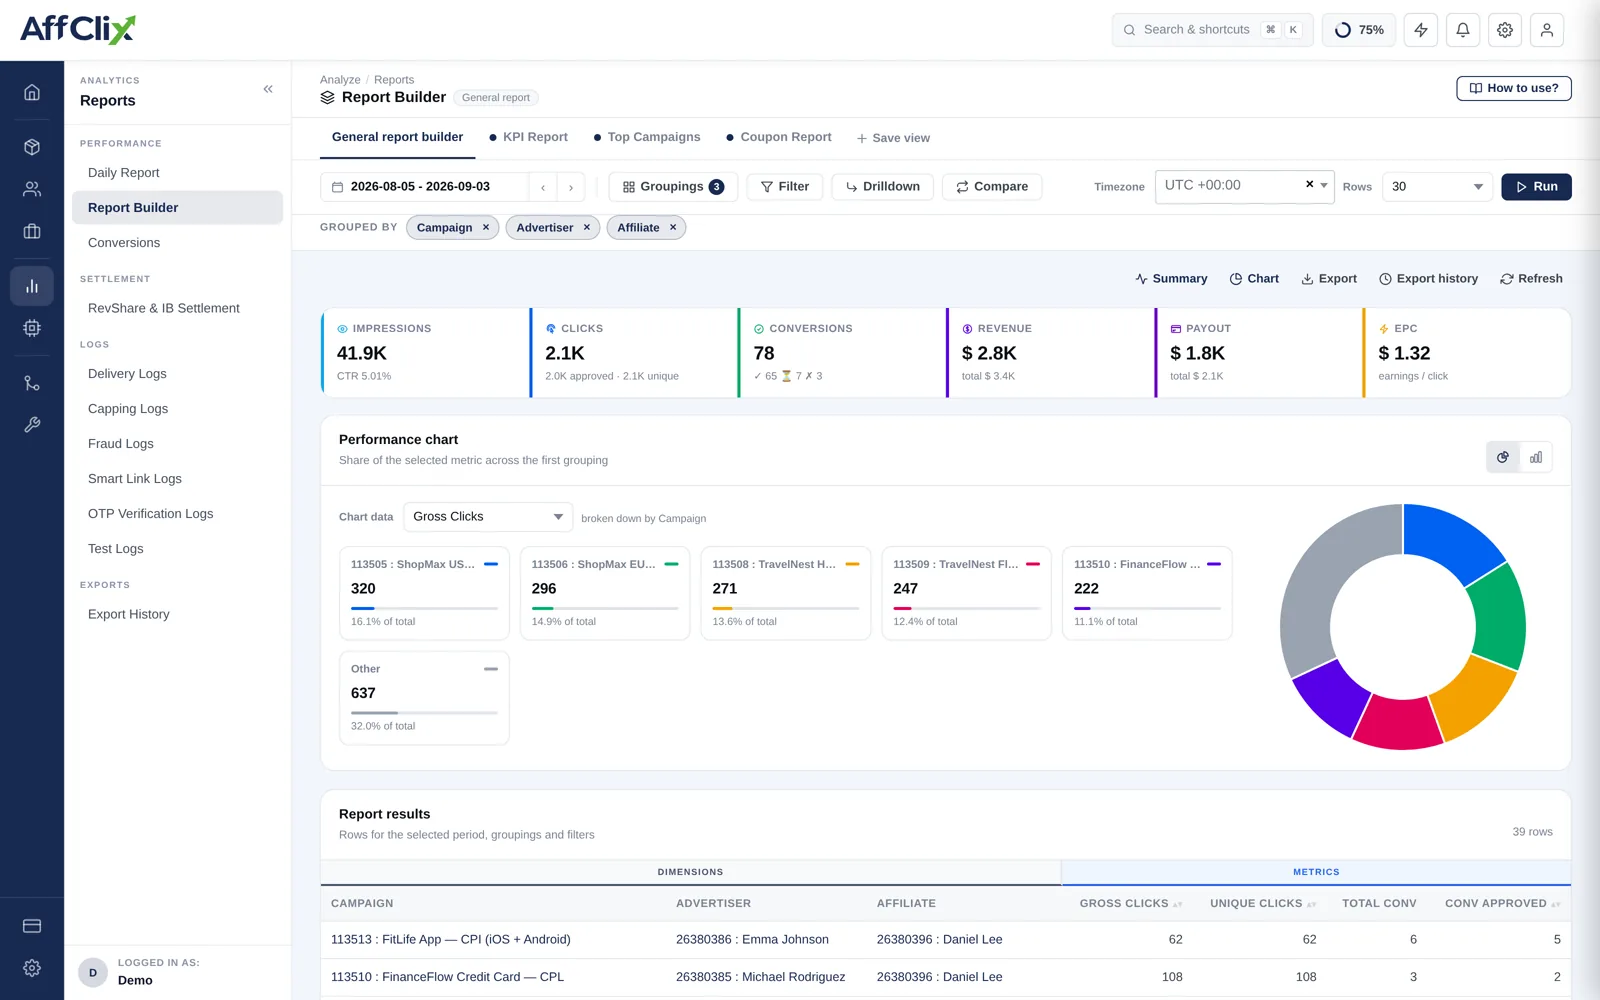
Groupings, Metrics, Filters
Every report is these three choices, and getting the distinction right is most of the skill.
| Part | What it controls | Examples |
|---|---|---|
| Groupings | The rows. Each unique combination becomes one row. | Campaign, affiliate, country, date, sub-ID, device, OS |
| Metrics | The columns. What is counted or summed per row. | Impressions, clicks, conversions, revenue, payout, CR, EPC |
| Filters | Which underlying records are included at all. | Date range, campaign, affiliate, status, country |
Grouping by country gives you one row per country. Filtering to a country gives you only that country's data. Use a filter to narrow the question, a grouping to break the answer apart.
Building a Report
Set the date range first
It is the filter with the biggest effect on both the result and how long the query takes.
Choose one or two groupings
Start narrow. Every additional grouping multiplies the row count, and a report with thousands of rows answers nothing.
Select the metrics you actually need
Selecting every available metric produces a table too wide to read.
Apply filters
Status is the one most often forgotten — including rejected conversions will overstate performance.
Press Run
Results do not refresh automatically as you change options. Nothing changes until you run it.
Saved Views
A configuration you will use again can be saved as a view and reopened with the same groupings, metrics and filters. Worth doing for anything you rebuild more than twice — a weekly partner review, a monthly advertiser reconciliation, a standing quality check.
Name views after the question they answer, not the fields they contain. Weekly affiliate quality review beats aff + country + CR.
Useful Recipes
| Question | Group by | Metrics |
|---|---|---|
| Which affiliates are actually profitable? | Affiliate | Clicks, conversions, revenue, payout, CR |
| Which geos convert best on this campaign? | Country | Clicks, conversions, CR, EPC |
| Which traffic source is a partner using? | Affiliate, sub_aff1 | Clicks, conversions, CR |
| Is performance trending down? | Date | Clicks, conversions, CR, revenue |
| Mobile versus desktop | Device, OS | Clicks, conversions, CR |
| Where is margin thinnest? | Campaign | Revenue, payout, conversions |
Exporting
Results can be exported to CSV. Large exports are queued rather than generated inline — they appear under Export History when ready, so a big date range does not block the screen.
Pitfalls
| Pitfall | What goes wrong |
|---|---|
| Too many groupings | Row count explodes and every row has too little volume to be meaningful. |
| Forgetting the status filter | Pending and rejected conversions inflate the numbers. |
| Comparing incomplete periods | Today against a full day yesterday always looks like a collapse. |
| Reading CR on tiny samples | One conversion on three clicks is not a 33% conversion rate. |
| Ignoring the conversion lag | Recent days look weak because their conversions have not arrived yet. |
A conversion can arrive well after its click, up to the campaign's validation window. Exclude the most recent day or two from trend comparisons, or you will keep diagnosing a decline that fills in by the end of the week.